Pilot Test For New Weight Loss Program
Led a two-month research initiative to assess program readiness

Project Overview
Duration
Nov. 2024 - Jan. 2025 2 months
Objectives
To assess program launch readiness based on user outcomes and feedback, and identify pain points or drop-off risks ahead of the public launch.
Challenge
The two-month timeline made it challenging to continuously gather user feedback and track engagement without disrupting their experience.
Outcome
Identified 5 major pain points and proposed solutions achievable within one month before launch.
My Role & Deliverables
Researcher
Planned and executed the entire research strategy, including qualitative interviews, diary studies, quantitative surveys, and app data analysis.
Analyzed interview results for product decisions.
UX Designer
Design the mechanism to enhance the sense of feedback upon task completion.

This was the company’s first step into the weight loss space, as well as the first time using a new internal tool to build digital programs within the app. Before launch, we needed to ensure the program was effective and validate its usability. To do so, we conducted a two-month pilot test with 11 real users to evaluate the experience and collect feedback.
Background
Research Methods

App Usage Data
Track weight changes and engagement
Observation
Observed consultation sessions to uncover challenges.

Weekly Survey
Collected feedback on weekly tasks and articles

Diary Study
Tracked user behavior and feelings during the first 3 days.

Interview
Gathered overall experience feedback
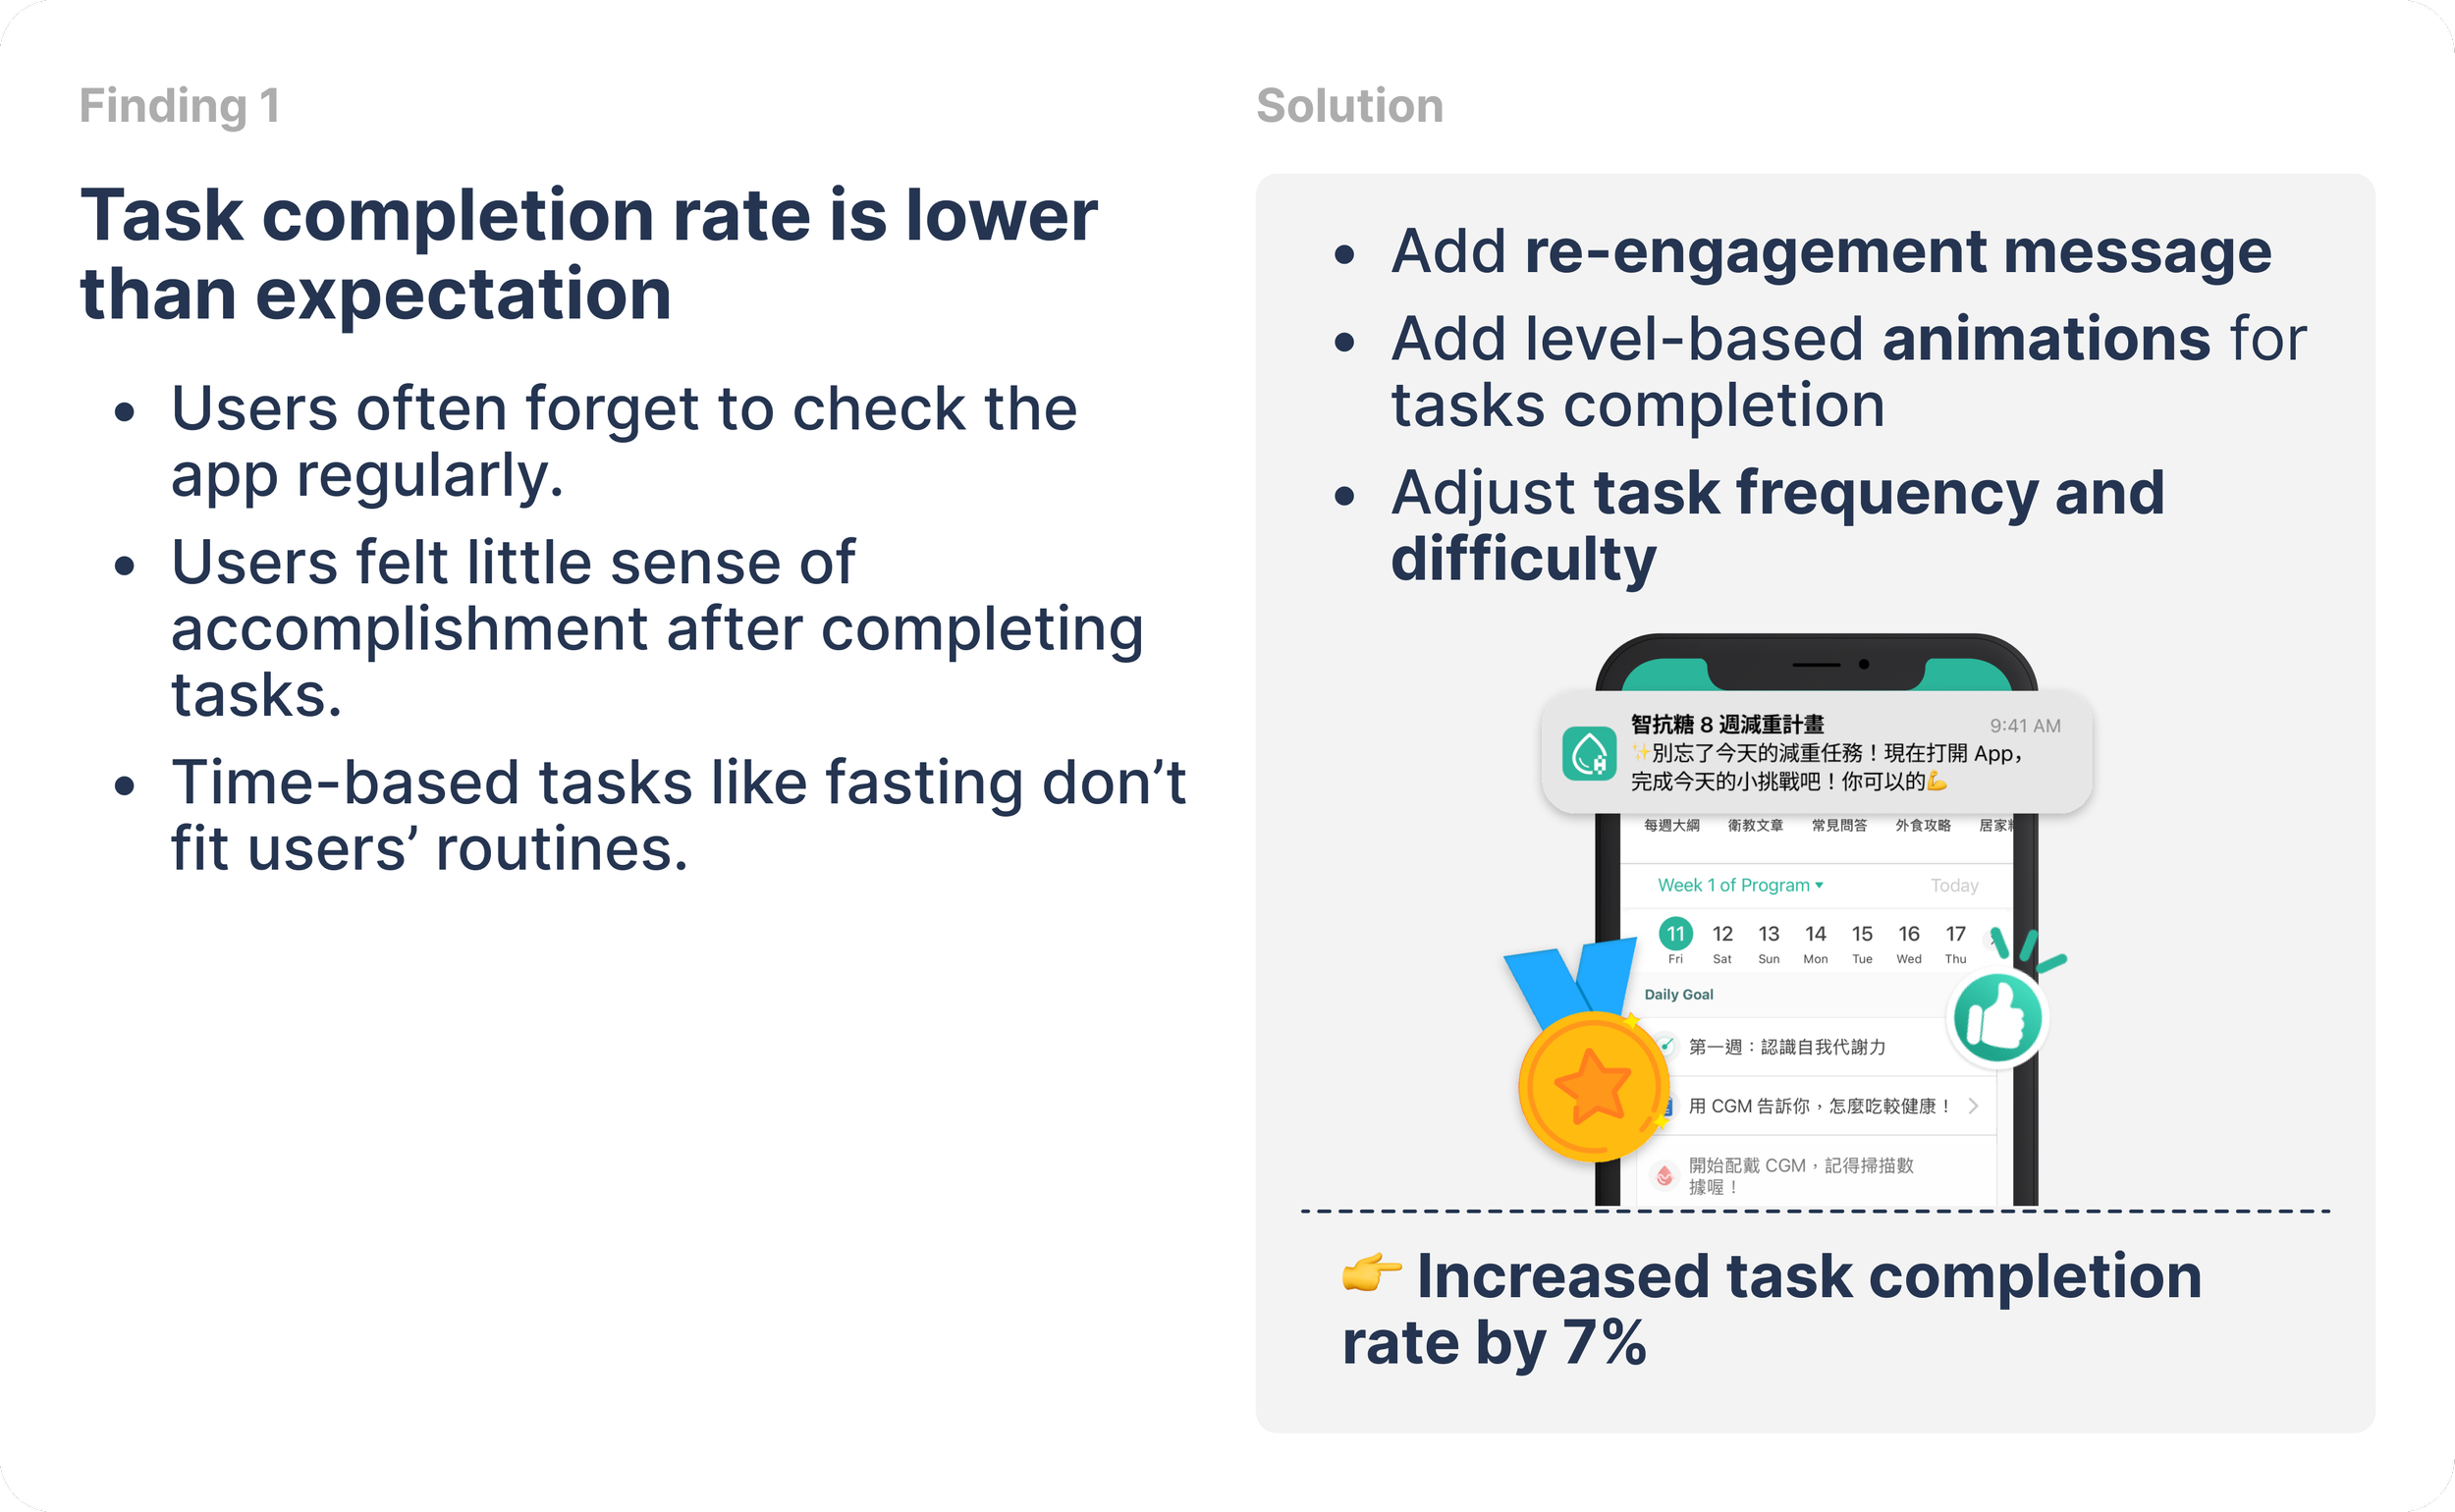
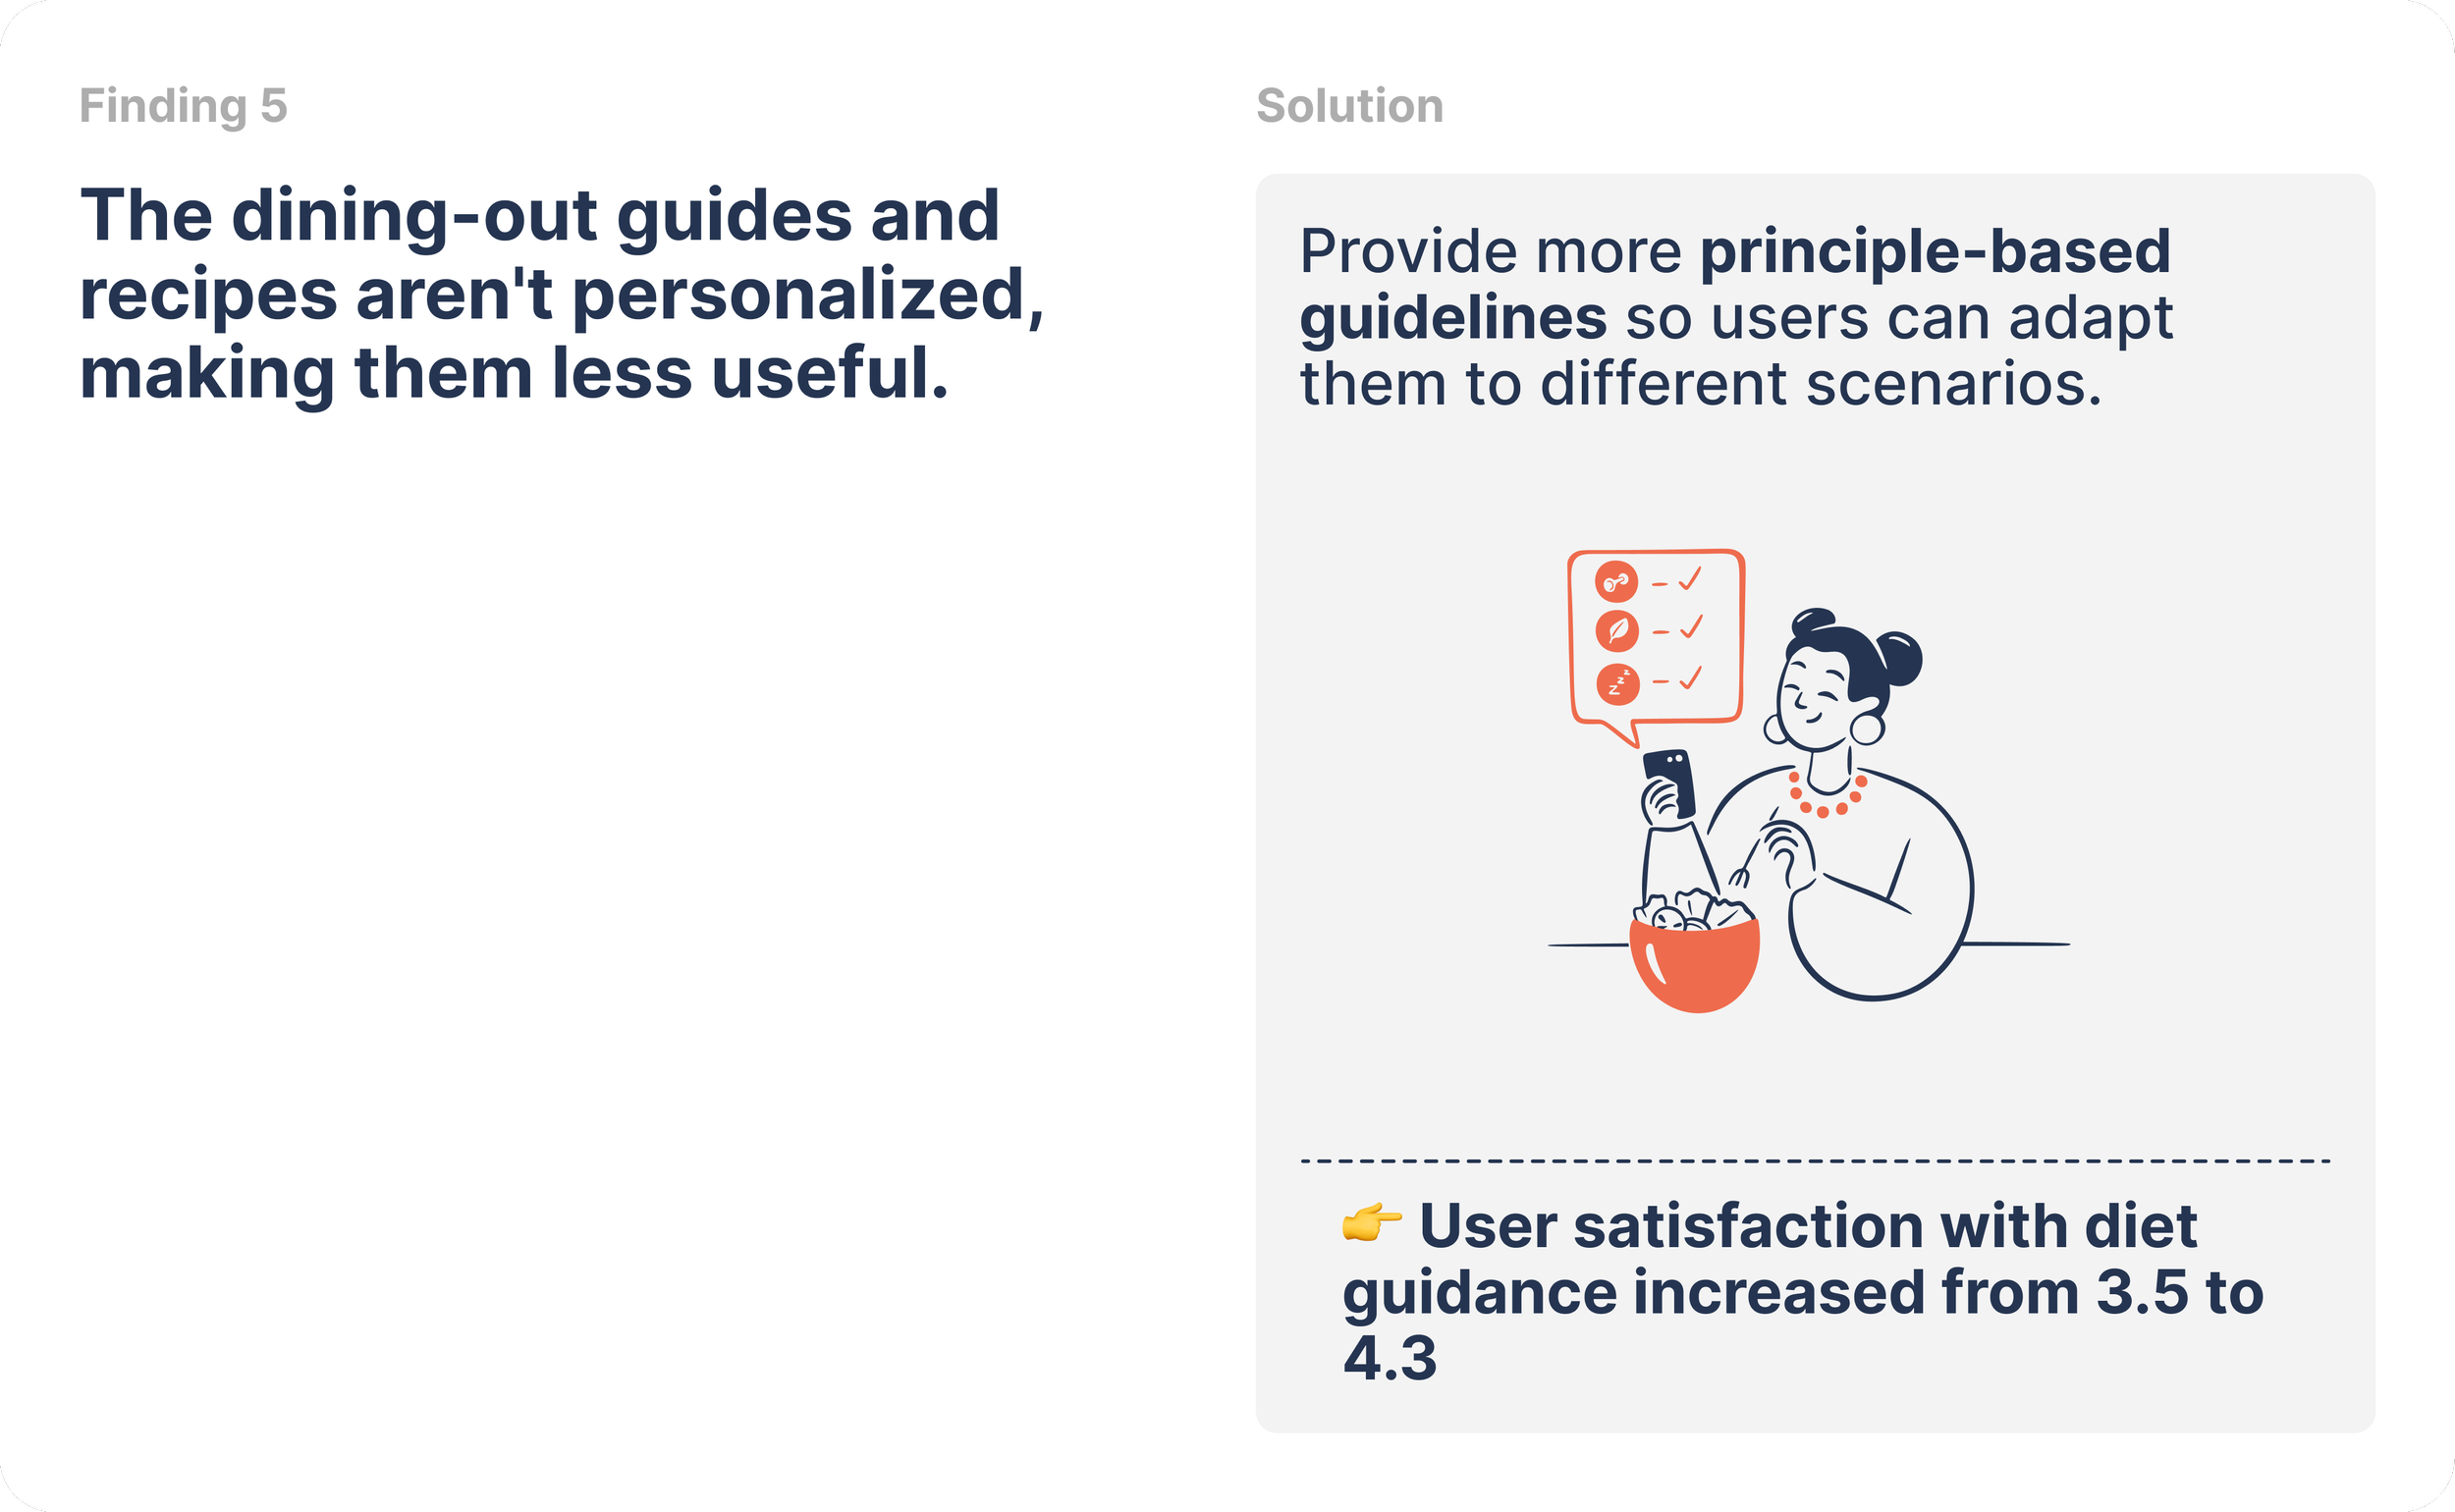
Key Research Findings
Below are five key research findings uncovered through the study, which prompted the product and marketing teams to implement improvements within limited time and resources, ultimately enhancing the overall program experience.